
If you’re running paid campaigns, you already know that every cent spent matters. Tracking performance effectively allows you to make data-driven decisions and optimize your ad spend. But how do you transform raw data into actionable insights without spending hours on manual reporting?
The answer lies in automation. With powerful no-code tools like Make and Google Sheets, you can build a fully automated reporting system in just a few minutes—without writing a single line of code.
In this tutorial, we’ll walk through how to extract Facebook Ads performance data, including placement and device breakdowns, and automatically populate it into Google Sheets. Let’s dive in.
Step 1: Define Your Reporting Goal
Before setting up automation, it’s important to clarify your reporting objectives. Here are a few common goals:
✅ Track overall ad spend and ROI – Quickly determine if your campaigns are profitable.
✅ Analyze ad performance at a granular level – Identify which creatives, ad sets, and campaigns perform best.
✅ Understand audience behavior by platform and device – Optimize your budget by knowing where and how users engage with your ads.
The best part? You don’t have to choose just one. With Make, you can automate all of these insights in a single workflow.
Step 2: Plan Your Automation Workflow
For this tutorial, we’ll focus on extracting ad-level data with placement and device breakdowns. Our workflow consists of three main steps:
1️⃣ Retrieve all ad IDs from your Facebook Ads account.
2️⃣ Fetch performance data for each ad, including clicks, impressions, and spend.
3️⃣ Send the data to Google Sheets for analysis and visualization.
Now, let’s bring this workflow to life in Make.
Step 3: Setting Up the Scenario in Make
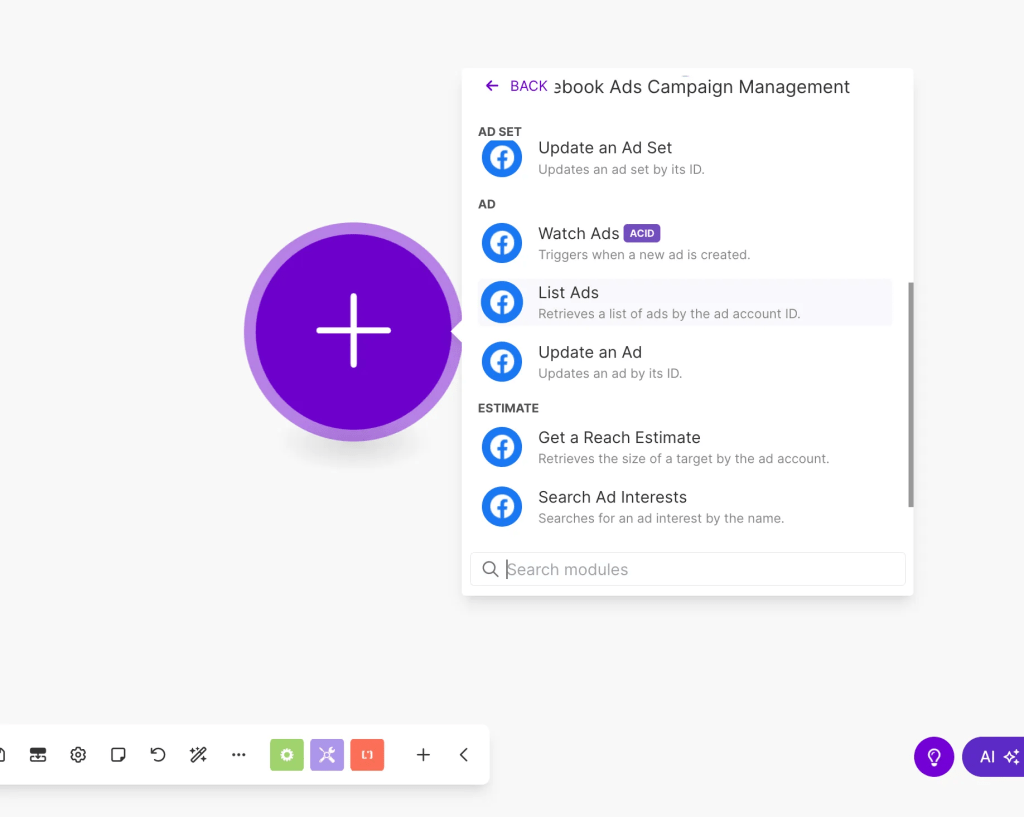
Start by creating a new Scenario in Make. Then, add the Facebook Ads Campaign Management module.

Choose the List Ads action. This ensures we retrieve data at the most detailed level. If you prefer higher-level insights, you can select the Ad Set or Campaign level instead.
Configuring the Module
Once selected, configure the module by specifying:
- Your Facebook connection
- The Business & Ad Account you want to extract data from
- A specific campaign (optional, if you want to filter by campaign)
- The ad status (e.g., Active, Inactive, All)
For this tutorial, we’ll retrieve all ads from the account, regardless of their status.

Now, run the module once to test the connection and ensure it pulls the correct data.

With our ad list ready, let’s move on to retrieving performance metrics.
Step 4: Fetching Performance Data
Next, add the Facebook Insights module and select Get Insights.

Configuring the Insights Module
Connect the Insights module to your trigger and configure it as follows:
- Entity Type: Select Ad to get performance data at the most granular level.
- Ad Account: Choose the relevant ad account.
- Ad ID: Use the ID from the previous step to fetch insights for each ad.
- Metrics: Select the performance fields you want to retrieve.

For this example, we’ll extract:
- Ad ID
- Ad Name
- Ad Set ID & Name
- Campaign ID & Name
- Clicks, Impressions, Reach, and Spend
- Date (Start & End)

Adding Breakdowns for Deeper Insights
Breakdowns allow you to analyze data by specific dimensions, such as platform, device, age, and gender. You can combine multiple breakdowns to get even deeper insights.
For this tutorial, we’ll break down performance by platform and placement to see which channels drive the best results.

If you want to explore additional breakdown options, check out this official Facebook guide.
Now that we have the data, it’s time to store it in Google Sheets.
Step 5: Storing Data in Google Sheets
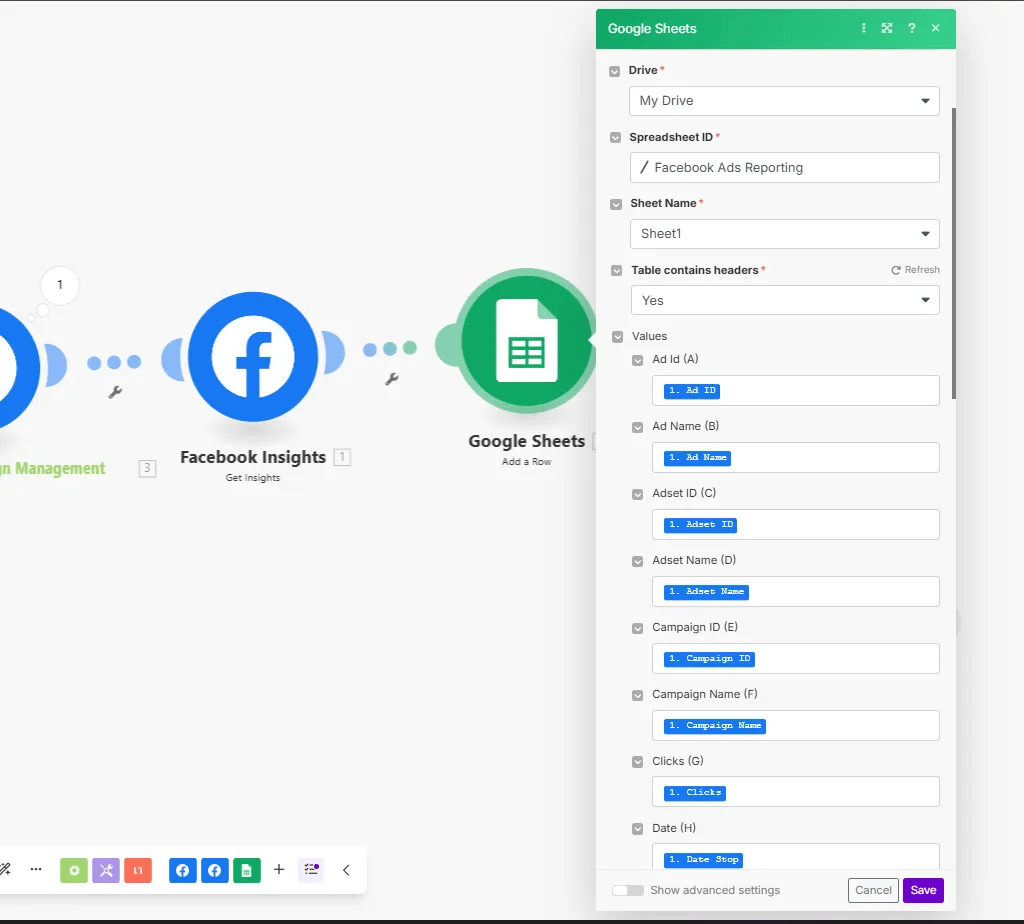
Add the Google Sheets “Add a Row” module to your workflow.

Before configuring the module, create a Google Sheet with column headers that match the data fields you retrieved. For example:
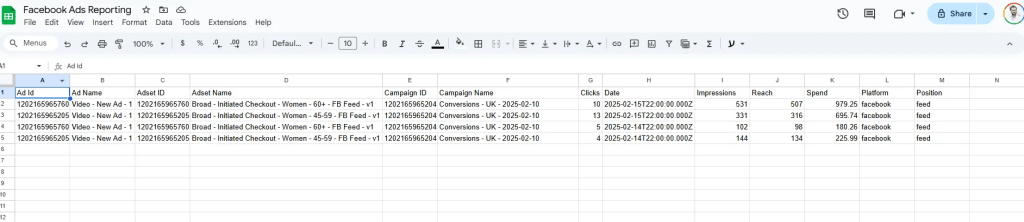
| Ad ID | Ad Name | Ad Set ID | Ad Set Name | Campaign ID | Campaign Name | Clicks | Impressions | Reach | Spend | Platform | Placement |
|---|
Now, configure the module by mapping each Facebook Ads field to its corresponding column in the sheet.

Once all fields are mapped, your automation is ready to run!
Step 6: Running & Testing Your Automation
Click “Run Once” in Make to execute the scenario. If everything is set up correctly, you’ll see new rows appear in your Google Sheet in real-time.

From here, you can:
📊 Create reports and dashboards in Google Sheets or Power BI.
🔄 Schedule the automation to run daily, weekly, or in real-time.
🚀 Expand the workflow by integrating with Slack, email notifications, or Google Data Studio.
Final Thoughts: Why Automate Your Facebook Ads Reporting?
Manually pulling reports is time-consuming and inefficient. By automating the process with Make and Google Sheets, you:
✅ Save hours of manual work each week
✅ Eliminate human error in data collection
✅ Access real-time performance insights to optimize ad spend faster
Whether you’re a marketer, business owner, or analyst, this automation helps you focus on strategy and decision-making instead of data wrangling.
🚀 Now it’s your turn! Set up your own Make scenario and start automating your Facebook Ads reporting today.
Got questions? Let me know in the comments!


Leave a comment